My Model and its Predictions
I ran a state-level ordinary least squares regression. For the non-battleground states, I used the lagged vote shares to predict which candidate would win that particular state. I used polling data, fundamentals (Q2 gdp growth, and demographics (age, race, and education level) to predict which candidate would win in each state. Since there was not enough polling data for all states, I focused on the ones that did–battleground states. I ran an elastic net on my OLS regression model to deal with multicollinearity. Some variables like race and education level may be correlated. Additionally I ran 10,000 simulations to create 95% confidence intervals.
The total list of predictors in my OLS regression is: latest_pollav_DEM, D_pv2p_lag1, D_pv2p_lag2 +, q2_gdp_growth, white, black, american_indian, asian_pacific_islander, less_than_college, college, hispanic, age_18_to_29, age_30_to_64, age_65_75plus.
My model predicted a Trump victory with 285 electoral college votes and 258 electoral college votes for Harris. My model inaccurately predicted that Georgia and Arizona would go for Harris.
| state | D2pv | my_prediction | Winner | pred_Winner |
|---|---|---|---|---|
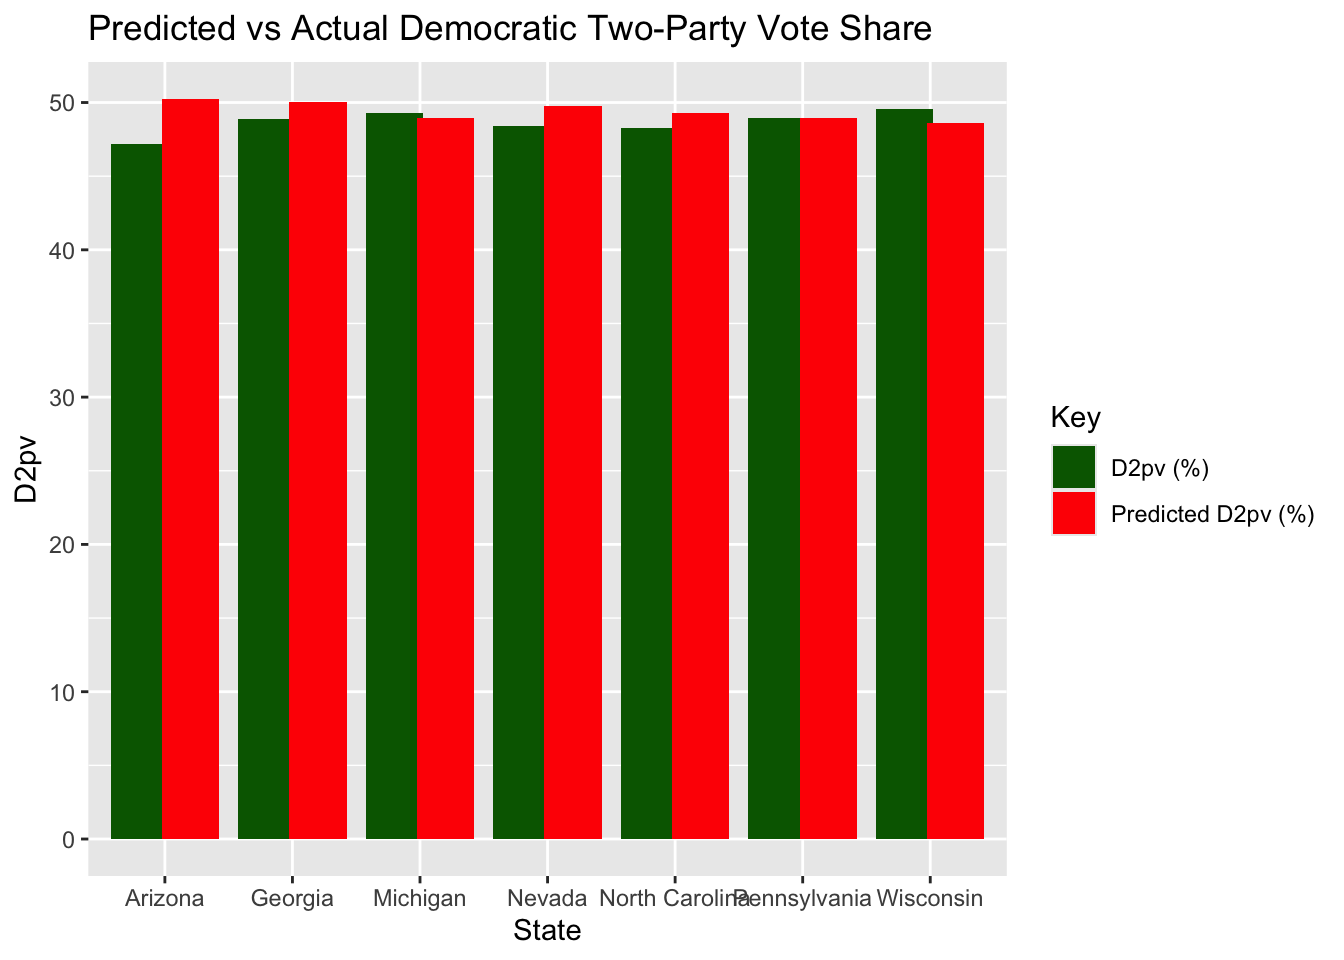
| Arizona | 47.15253 | 50.24998 | Trump | Harris |
| Georgia | 48.87845 | 50.04388 | Trump | Harris |
| Michigan | 49.30156 | 48.95665 | Trump | Trump |
| Nevada | 48.37829 | 49.74023 | Trump | Trump |
| North Carolina | 48.29889 | 49.29332 | Trump | Trump |
| Pennsylvania | 48.98235 | 48.92587 | Trump | Trump |
| Wisconsin | 49.53156 | 48.62988 | Trump | Trump |
In the bar chart below, I have plotted my predicted Democratic two-party vote share compared to actual Democratic two-party vote share in the battleground states.
Accuracy of my Model
To quantify the accuracy of my model, I calculated the MSE, RMSE, MAE, and Bias. The findings are presented in the table below.
The average squared difference between predicted and actual Democratic vote shares is 2.104.
The average error is approximately 1.45 percentage points.
The average absolute error between my predicted and actual Democratic vote share is 1.13 percentage points
My bias score indicates that I overestimated the Democratic party vote share by 0.76 points on average.
| metric | value |
|---|---|
| MSE | 2.104484 |
| RMSE | 1.450684 |
| MAE | 1.131759 |
| Bias | -0.759456 |
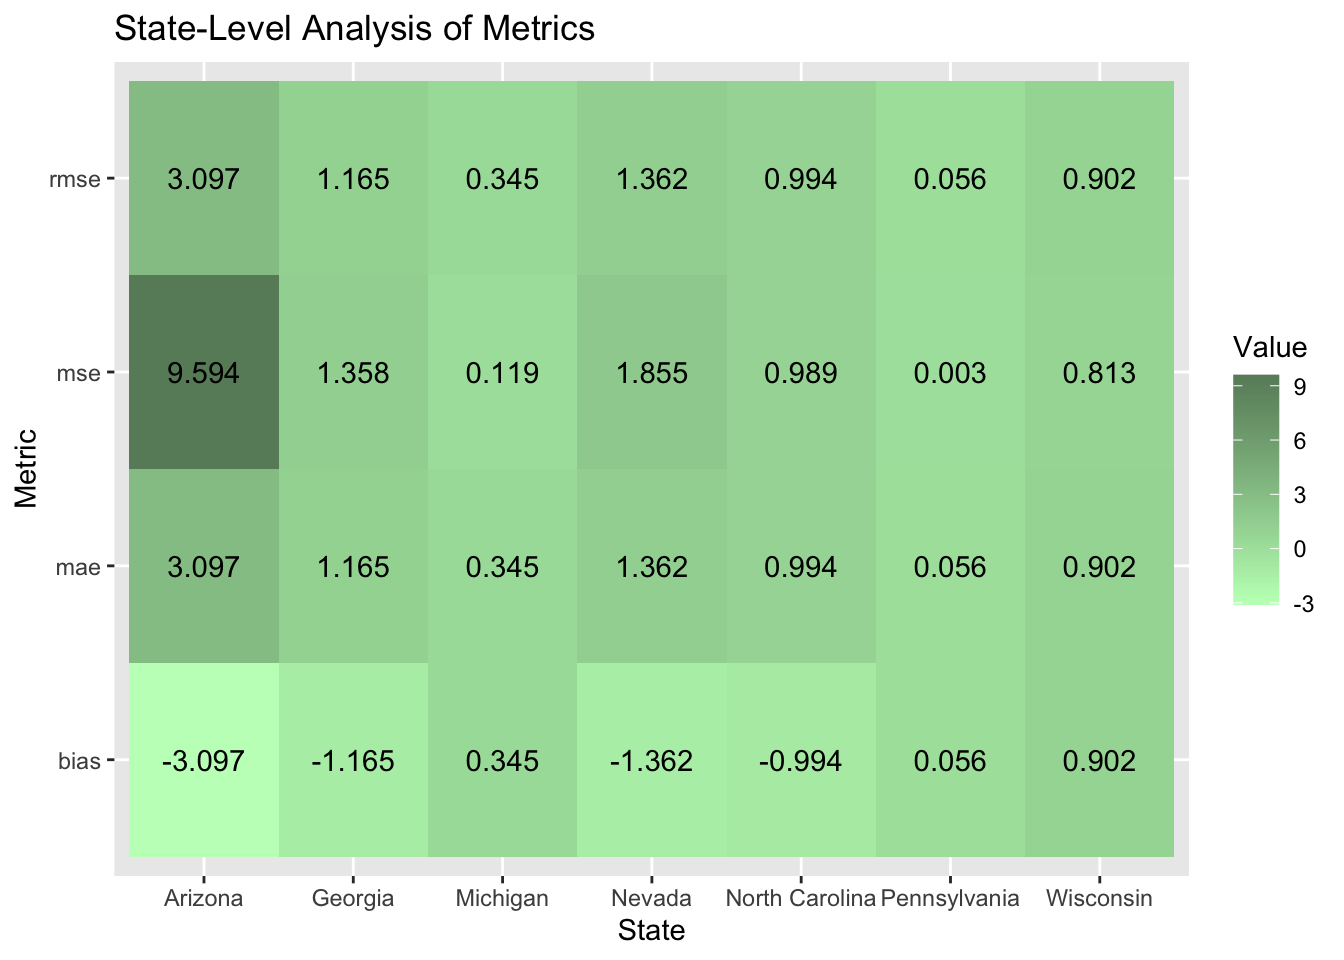
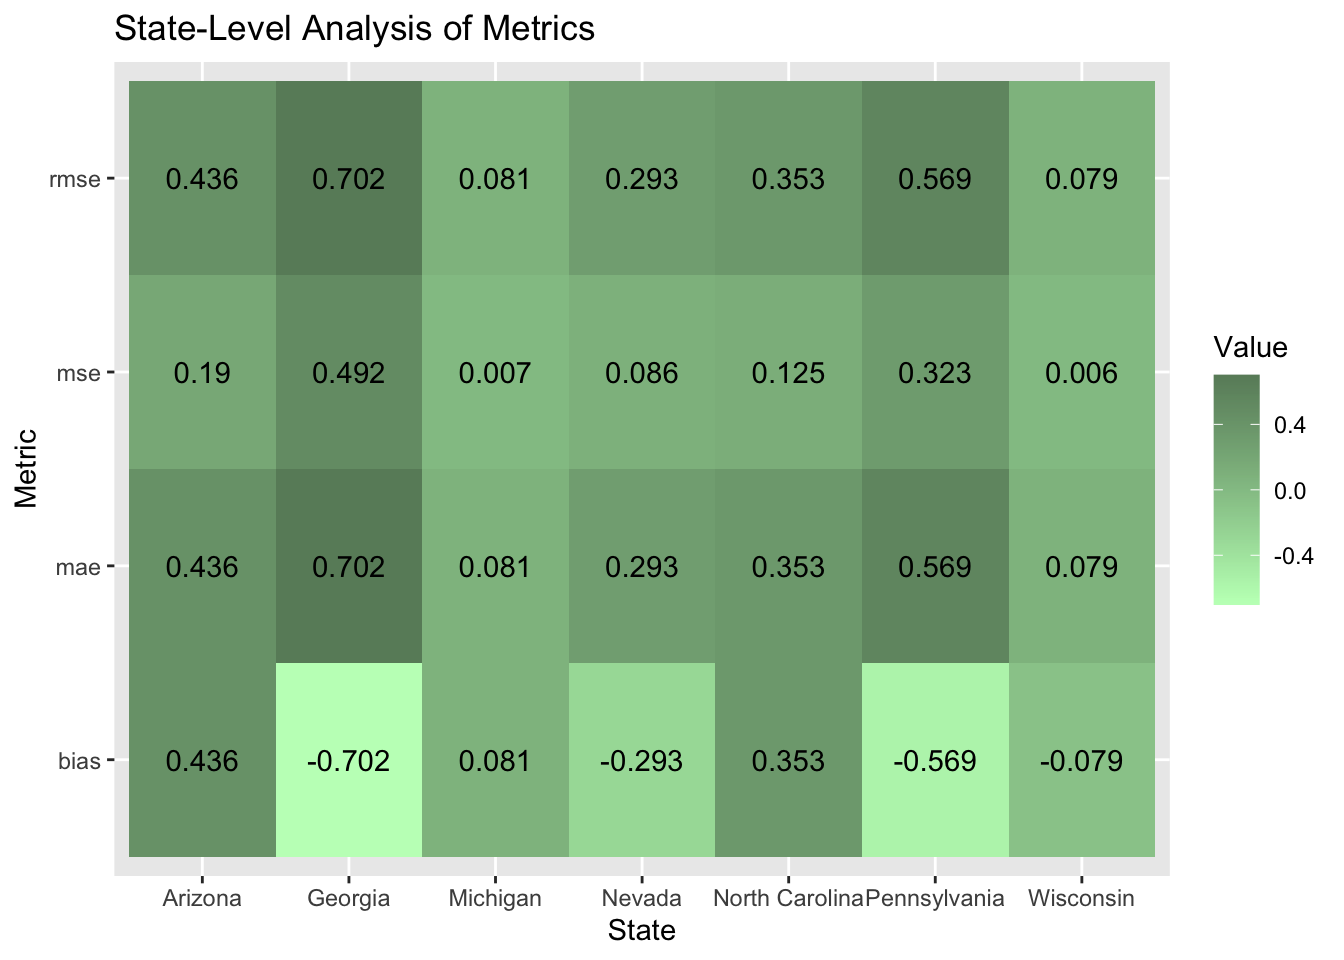
I performed a state-level analysis to test how well my model worked in certain states. My model performed the worst in Arizona where I overestimated the Democratic party vote share by a little over three percentage points. The model performed the best in Pennsylvania where the MSE value was 0.003.
| state | D2pv | my_prediction | Winner | pred_Winner | mse | rmse | mae | bias |
|---|---|---|---|---|---|---|---|---|
| Arizona | 47.15253 | 50.24998 | Trump | Harris | 9.5942180 | 3.0974535 | 3.0974535 | -3.0974535 |
| Georgia | 48.87845 | 50.04388 | Trump | Harris | 1.3582278 | 1.1654303 | 1.1654303 | -1.1654303 |
| Michigan | 49.30156 | 48.95665 | Trump | Trump | 0.1189596 | 0.3449052 | 0.3449052 | 0.3449052 |
| Nevada | 48.37829 | 49.74023 | Trump | Trump | 1.8548872 | 1.3619424 | 1.3619424 | -1.3619424 |
| North Carolina | 48.29889 | 49.29332 | Trump | Trump | 0.9888821 | 0.9944255 | 0.9944255 | -0.9944255 |
| Pennsylvania | 48.98235 | 48.92587 | Trump | Trump | 0.0031896 | 0.0564765 | 0.0564765 | 0.0564765 |
| Wisconsin | 49.53156 | 48.62988 | Trump | Trump | 0.8130231 | 0.9016779 | 0.9016779 | 0.9016779 |
Below is a heat map with the error metrics visualized. The bias in my model did not disproportionately overestimate the Democratic two-party vote share. In four states: Arizona, Georgia, Nevada, and North Carolina it did overestimate the Democratic two party vote share. However, my model did overestimate Trump’s winning margin in Michigan, Pennsylvania, and Wisconsin although the bias for Trump was less on average. I found this interesting because the states were I overestimated Trump’s winning margin were also the ones that were hypothesized by political pundits to go for Harris. Michigan and Wisconsin provided hope for Harris because they used to make up the blue wall. I knew immediately that my model was predicting Arizona wrong because polling data showed that out of the seven battleground states, Arizona was one of the least likely states to go for Harris.
To investigate why there is no direction in bias for my model I will go back to my OLS regression results and explore which of my variables might have affected my model.
I created a confusion matrix. The confusion matrix shows that I did not predict Harris would win any state that Trump actually won. It is easier to understand the errors because Trump had a clean sweep of the battleground states and my model only predicted he would win 5 which means that the error comes from predicting a Harris win in Arizona and Georgia where Trump won.
Reflection
I used a combination of demographics, polling data, and economic indicators to predict the electoral college results and the democratic two-party vote share in the battleground states with a OLS regression. One of the things that immediately stands out to me is that I may have made my model too complex. Although my model did not do a terrible job predicting the outcome of the election, I recognize from a statistical perspective that there were too many variables and some of them are not independent of one another which led to multicollinearity. For example, I have race and education level variables which are likely correlated in my linear regression. Additionally, I had a high r-squared value, around the high nineties which suggests that my model may be overfitting. To test whether the OLS regression model is not effective for predicting electoral outcomes, I could create an ensemble model or I could test the performance of my model with less variables.
In terms of the components of my model, I knew including demographic variables was a risk because the Kim & Zilinsky article we read a couple of weeks ago claims that five key demographic attributes can predict a voter’s choice about 68% of the time. I only use three of those key attributes so it may be even lower for my model in terms of its predicting capacity. Post-election exit polls show that Trump made gains with most demographic groups which indicates that demographic attributes may not have great predicting capacity in this election. To test this out I removed race variables from my model and this is how the update model performed below.
| metric | value |
|---|---|
| MSE | 0.6708597 |
| RMSE | 0.8190603 |
| MAE | 0.6860950 |
| Bias | 0.2835597 |
| state | D2pv | my_prediction | Winner | pred_Winner | update 1 | update 2 | mse | rmse | mae | bias |
|---|---|---|---|---|---|---|---|---|---|---|
| Arizona | 47.15253 | 50.24998 | Trump | Harris | 48.56140 | 46.71684 | 1.9849244 | 1.4088735 | 1.4088735 | -1.4088735 |
| Georgia | 48.87845 | 50.04388 | Trump | Harris | 48.66703 | 49.58014 | 0.0446983 | 0.2114197 | 0.2114197 | 0.2114197 |
| Michigan | 49.30156 | 48.95665 | Trump | Trump | 49.15558 | 49.22085 | 0.0213088 | 0.1459752 | 0.1459752 | 0.1459752 |
| Nevada | 48.37829 | 49.74023 | Trump | Trump | 47.59146 | 48.67112 | 0.6190976 | 0.7868276 | 0.7868276 | 0.7868276 |
| North Carolina | 48.29889 | 49.29332 | Trump | Trump | 47.90145 | 47.94593 | 0.1579621 | 0.3974445 | 0.3974445 | 0.3974445 |
| Pennsylvania | 48.98235 | 48.92587 | Trump | Trump | 48.33273 | 49.55108 | 0.4220015 | 0.6496165 | 0.6496165 | 0.6496165 |
| Wisconsin | 49.53156 | 48.62988 | Trump | Trump | 48.32905 | 49.61006 | 1.4460254 | 1.2025079 | 1.2025079 | 1.2025079 |
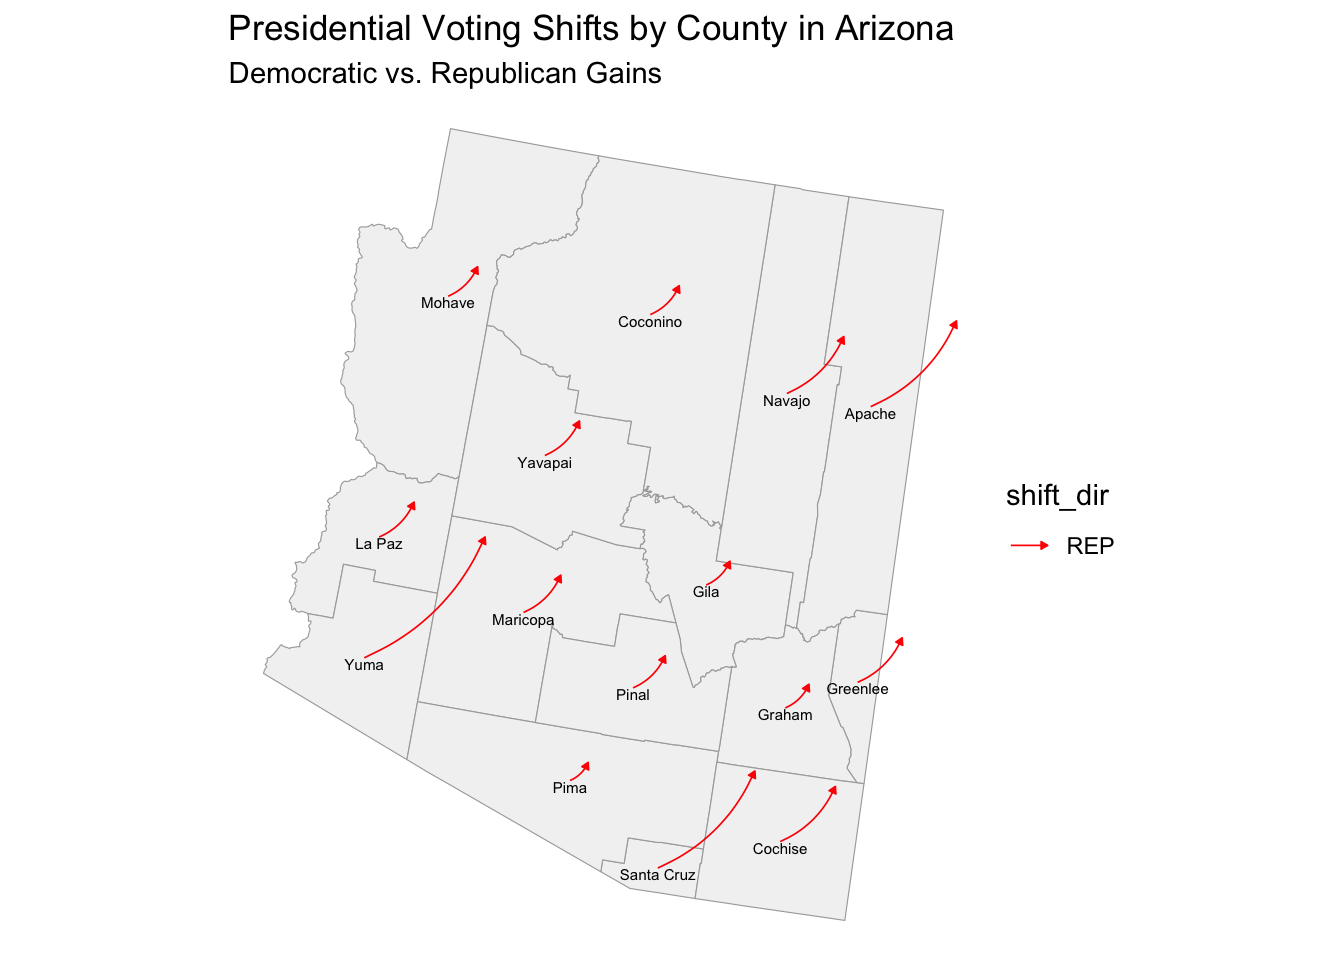
After removing the race variables from my model, it does perform better, accurately predicting a Trump victory in all battleground states, but has started to underestimate the Democratic two-party vote share in six out of the seven battleground states which I thought was interesting. The model once again overestimates the Harris margin which makes me wonder what about the variables and Arizona is so unique that it is not being captured by the variables in my model. I predict it has to do with the quality of polls in Arizona potentially overestimating Harris support in Arizona. The graphic below shows that Arizona substantially shifted to the right. To test whether the polls overestimated Harris support in the states like Arizona, we will have to wait until the votes are all counted and final election results are available and compare them to what the polls predicted.
Ultimately, it is not possible to know the impact of race until the voter files are available because exit polls are known to be less reliable. Once the voter file is available, I can test how demographic groups voted in the 2024 election.
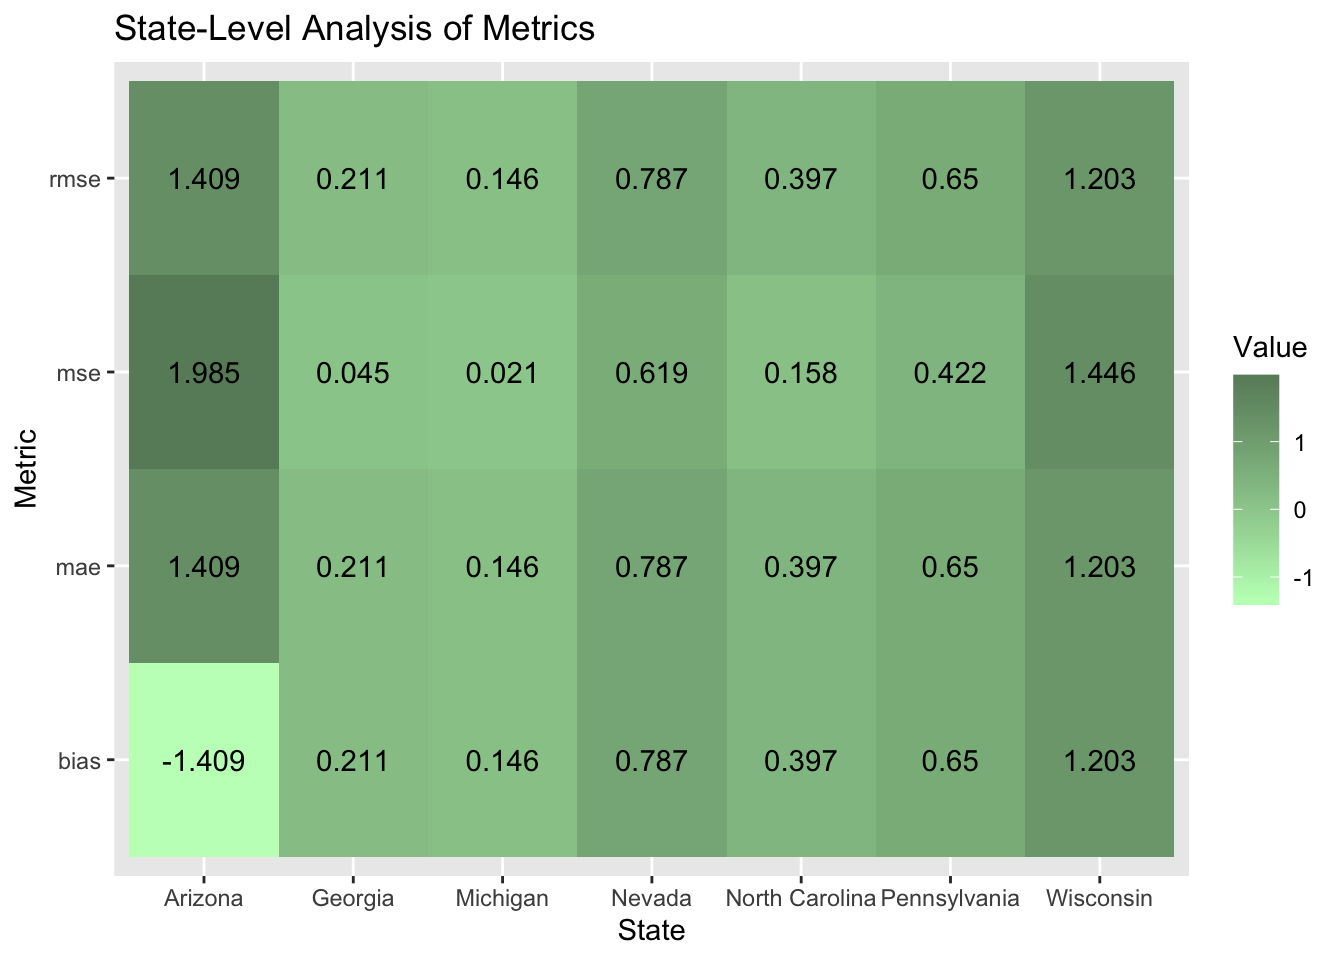
 I also looked back at my original OLS regression model and decided to select only the variables that were statistically significant. Interestingly, it was all of my race variables and the variable containing the latest polling data. I ran the same model again with these variables and this was the outcome (shown below).
| metric | value |
|---|---|
| MSE | 0.1755229 |
| RMSE | 0.4189546 |
| MAE | 0.3587306 |
| Bias | -0.1103432 |
| state | D2pv | my_prediction | Winner | pred_Winner | update 1 | update 2 | mse | rmse | mae | bias |
|---|---|---|---|---|---|---|---|---|---|---|
| Arizona | 47.15253 | 50.24998 | Trump | Harris | 48.56140 | 46.71684 | 0.1898228 | 0.4356865 | 0.4356865 | 0.4356865 |
| Georgia | 48.87845 | 50.04388 | Trump | Harris | 48.66703 | 49.58014 | 0.4923693 | 0.7016903 | 0.7016903 | -0.7016903 |
| Michigan | 49.30156 | 48.95665 | Trump | Trump | 49.15558 | 49.22085 | 0.0065133 | 0.0807052 | 0.0807052 | 0.0807052 |
| Nevada | 48.37829 | 49.74023 | Trump | Trump | 47.59146 | 48.67112 | 0.0857508 | 0.2928324 | 0.2928324 | -0.2928324 |
| North Carolina | 48.29889 | 49.29332 | Trump | Trump | 47.90145 | 47.94593 | 0.1245839 | 0.3529645 | 0.3529645 | 0.3529645 |
| Pennsylvania | 48.98235 | 48.92587 | Trump | Trump | 48.33273 | 49.55108 | 0.3234578 | 0.5687335 | 0.5687335 | -0.5687335 |
| Wisconsin | 49.53156 | 48.62988 | Trump | Trump | 48.32905 | 49.61006 | 0.0061626 | 0.0785021 | 0.0785021 | -0.0785021 |
When I only include the variables that were statistically significant, the model performs better than my original better and the one updates without race variables. The aggregate level MSE value is 0.17 which is close to 0, indicating very good accuracy. I think this is really interesting because the Kim & Zilinsky article did not show the demographic attributes had high predicting capacity. This latest iteration of my model shows that polling data and race variables predict this election outcome very well.
What does this say about the Q2 GDP growth? This was my only economic variable in my model. I did consider including unemployment but in the end opted to exclude because it was showing multicollinearity with Q2 GDP growth. When I added Q2 GDP growth to both of the updated models it increased the Democratic two-party vote share to the extent where it flipped states. I think this is the result of Trump’s perception as a successful business man. A couple of weeks ago, I listened to The Daily and in this episode, there were many clips of interviews with Nevada voters who said they were voting for Trump because of the economy. Inflation in 2022 and 2023 has tainted the economic image of the Biden administration and Harris was not able to escape that. I can test whether voter’s perception of the economy is a better predictor for electoral outcomes by switching out Q2 GDP growth with inflation or consumer economic index and include it in my model and see how it performs.
In a future iteration of this model I would also like to account for incumbency and make it an interaction variable with some economic indicator. Post-election discussion that I’ve heard suggests that Trump won because voters were dissatisfied with the economy and wanted change. I think an interaction variable could have captured public dissatisfaction and performed better.